Introduction: The Limitations of Screenshot-Based Analysis 📸❌
In today's rapidly evolving trading landscape, many traders still rely on sending screenshots or chart images to AI systems for analysis. While this might seem intuitive at first glance, it's actually one of the most inefficient ways to leverage artificial intelligence for trading decisions. 🤔
The Screenshot Problem
What You Send:
🔍 Limited visual data
❌ No mathematical precision
⏰ Outdated by the time it's processed
What AI Gets:
📏 Approximate values
🧠 Requires image recognition
⚡ Slower processing time
Think about it this way: when you send a screenshot, you're essentially asking the AI to guess what the numbers are by looking at pixels on a screen. It's like asking someone to solve a math problem by showing them a blurry photo of an equation instead of giving them the actual numbers! 🧮
The fundamental issue lies in the fact that images contain visual representations of data, not the actual data itself. When AI systems process images, they must first convert visual information back into numerical data—a process that introduces errors, delays, and limitations that can significantly impact trading performance.
The Advantages of Structured Market Data (OHLC) 📈✨
OHLC Data Structure
Open
Starting price of the period
High
Highest price reached
Low
Lowest price reached
Close
Final price of the period
OHLC data (Open, High, Low, Close) represents the gold standard for market data analysis. Unlike images, this structured format provides AI systems with precise numerical values that can be immediately processed without any interpretation layer. Here's why this matters so much:
- 🎯 Mathematical Precision: Every price point is exact to the pip, allowing for precise calculations of support/resistance levels, moving averages, and technical indicators.
- ⚡ Lightning-Fast Processing: No image recognition needed—AI can instantly perform complex mathematical operations on the raw data.
- 📊 Rich Information Density: A single OHLC candle contains more actionable information than what's visible in most chart screenshots.
- 🔄 Real-Time Compatibility: Structured data can be streamed live, enabling real-time analysis and decision-making.
When you provide OHLC data to an AI system, you're giving it the raw ingredients needed to cook up sophisticated trading strategies. The AI can calculate moving averages with perfect precision, identify exact Fibonacci retracement levels, and detect pattern formations with mathematical accuracy that would be impossible with image-based analysis.
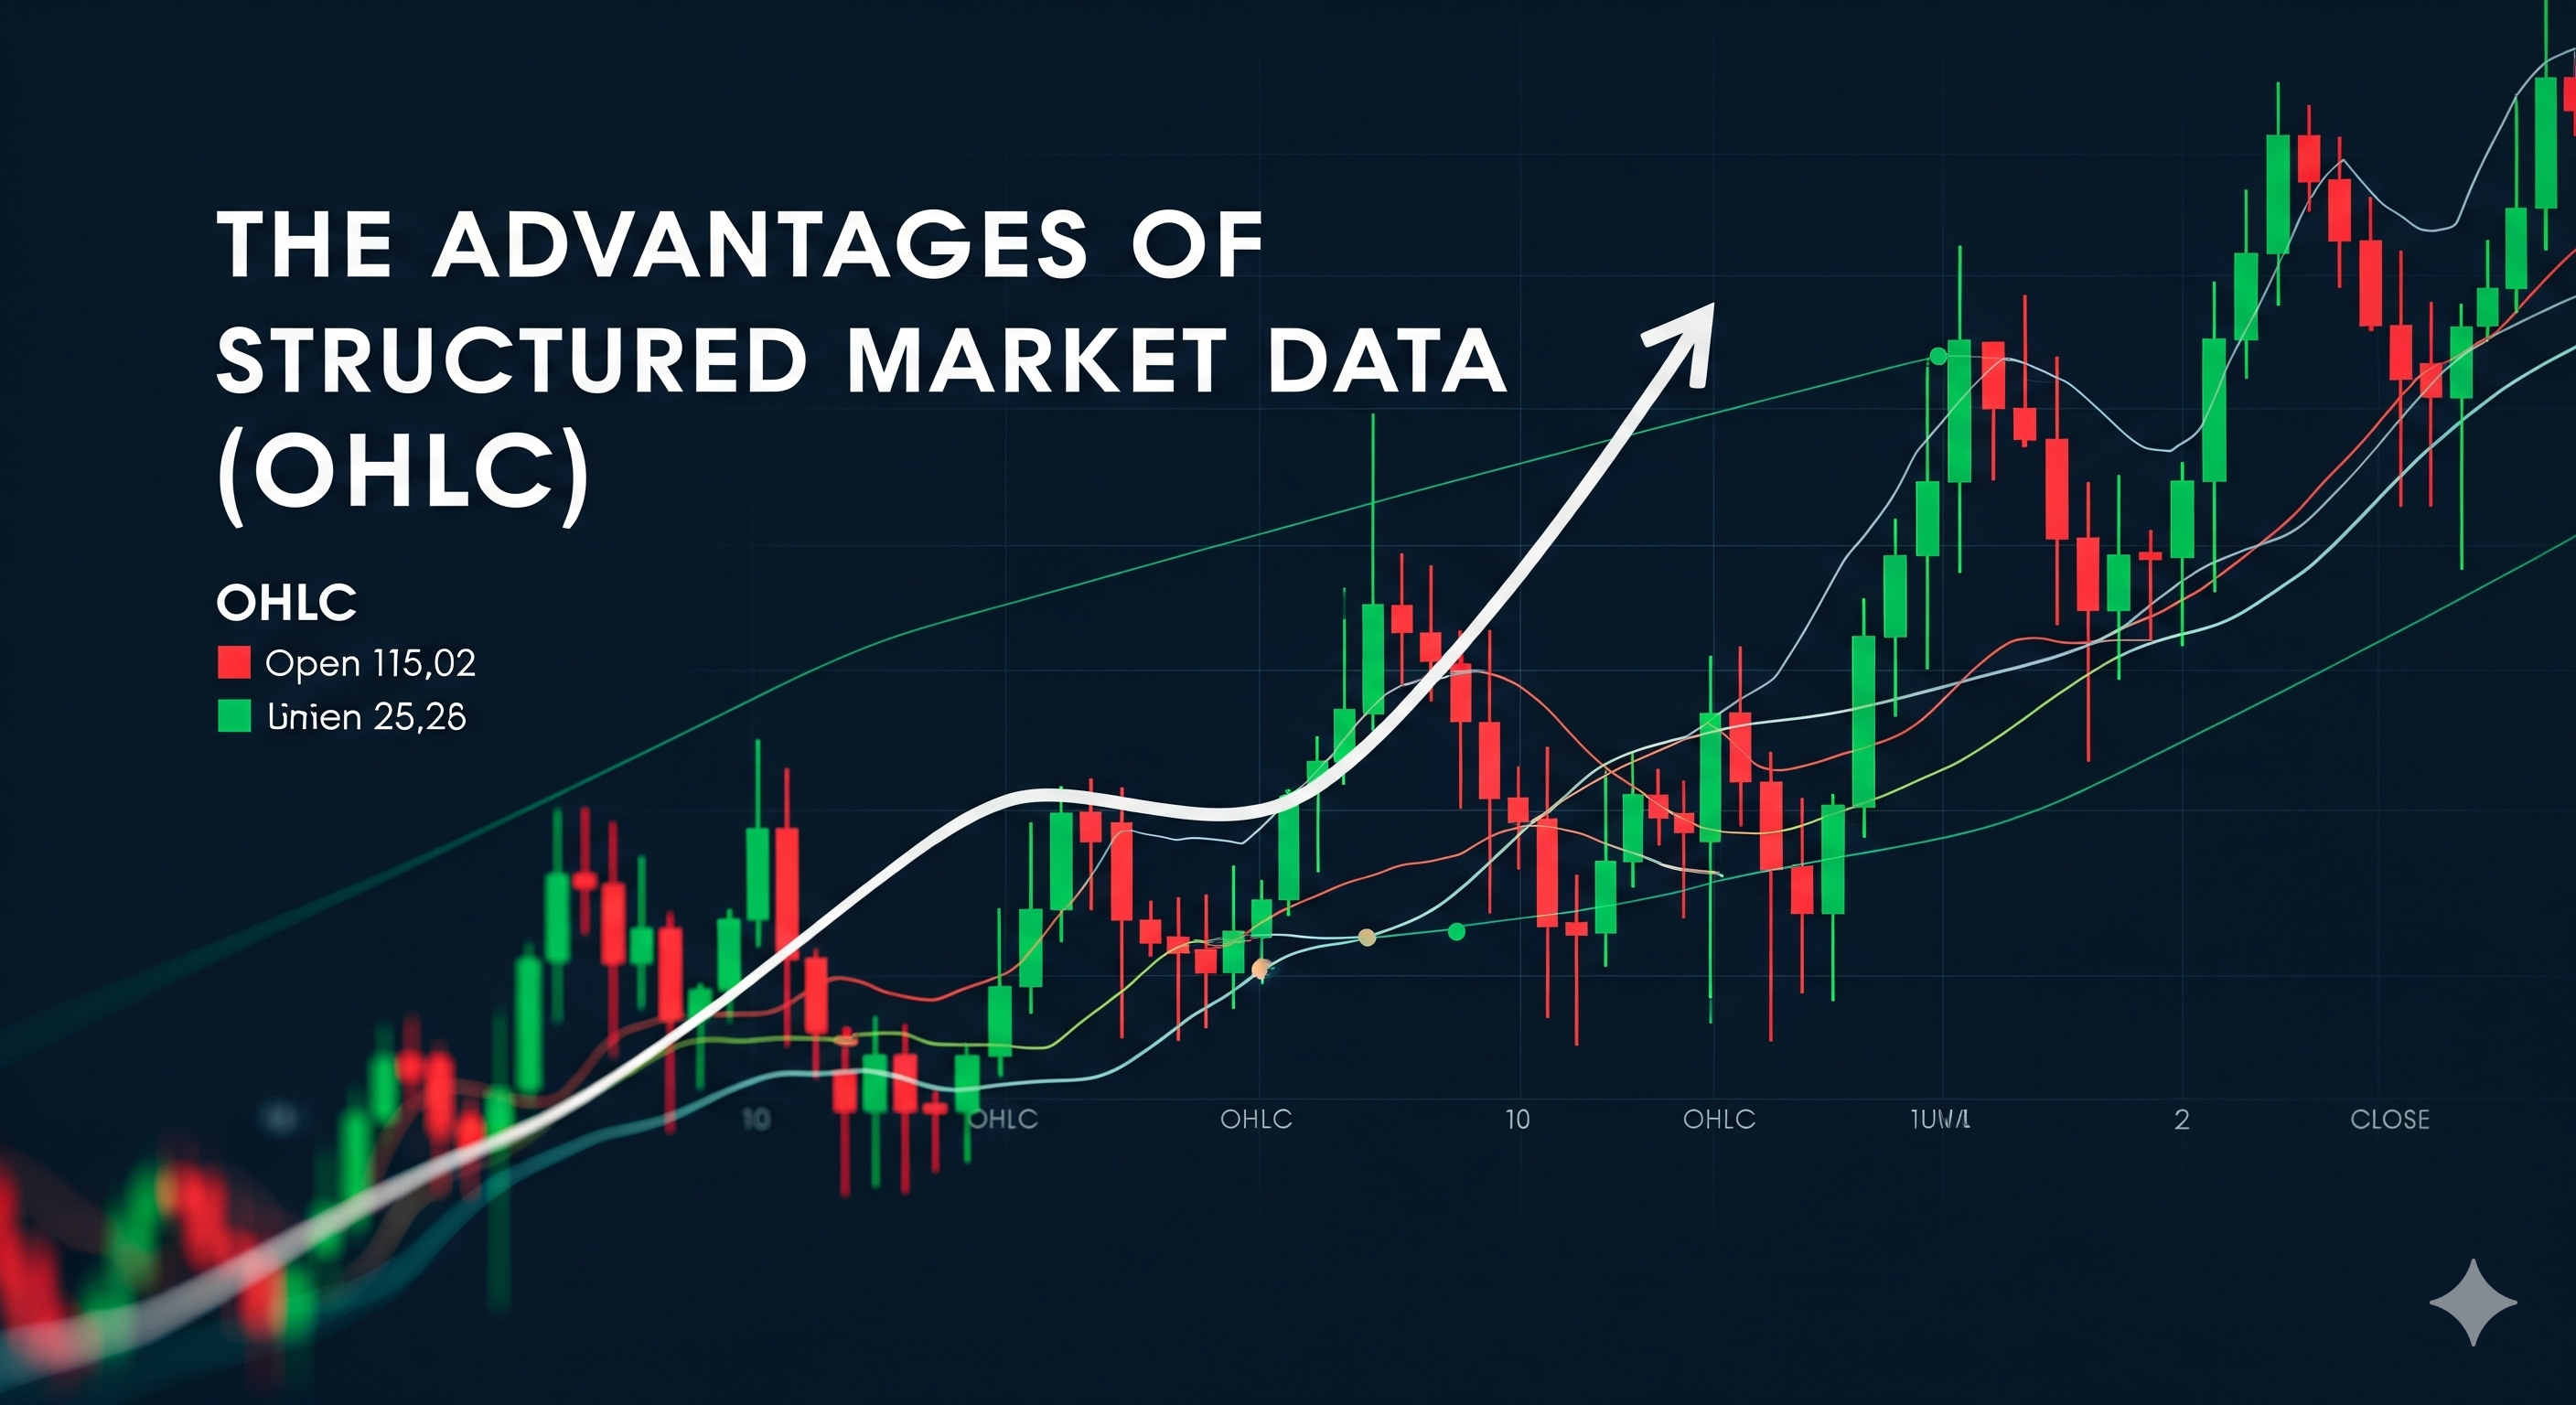
📊 OHLC structured data provides precise numerical values for AI analysis
Algorithmic vs. Visual Trading Strategies 🤖👁️
The difference between algorithmic and visual trading approaches is like comparing a precision surgical instrument to a rough sketch. Let me break this down with a real-world example that'll make everything crystal clear! 💡
Image-Based Analysis
OHLC Data Analysis
Here's a practical example: Let's say you want to implement a moving average crossover strategy. With an image, the AI might see that two lines are "close to crossing" but can't tell you the exact values. With OHLC data, the AI can calculate that the 20-period MA is at 1.2547 and the 50-period MA is at 1.2549, giving you a precise 0.2 pip difference and the exact moment when they'll cross! 🎯
Moreover, algorithmic strategies can incorporate multiple indicators simultaneously. While analyzing an image, you might see RSI and MACD separately, but with structured data, AI can create complex conditions like: "Enter long when RSI > 30 AND MACD histogram is increasing AND price is above 20-period EMA AND volume is 1.5x average." Try doing that with a screenshot! 😅
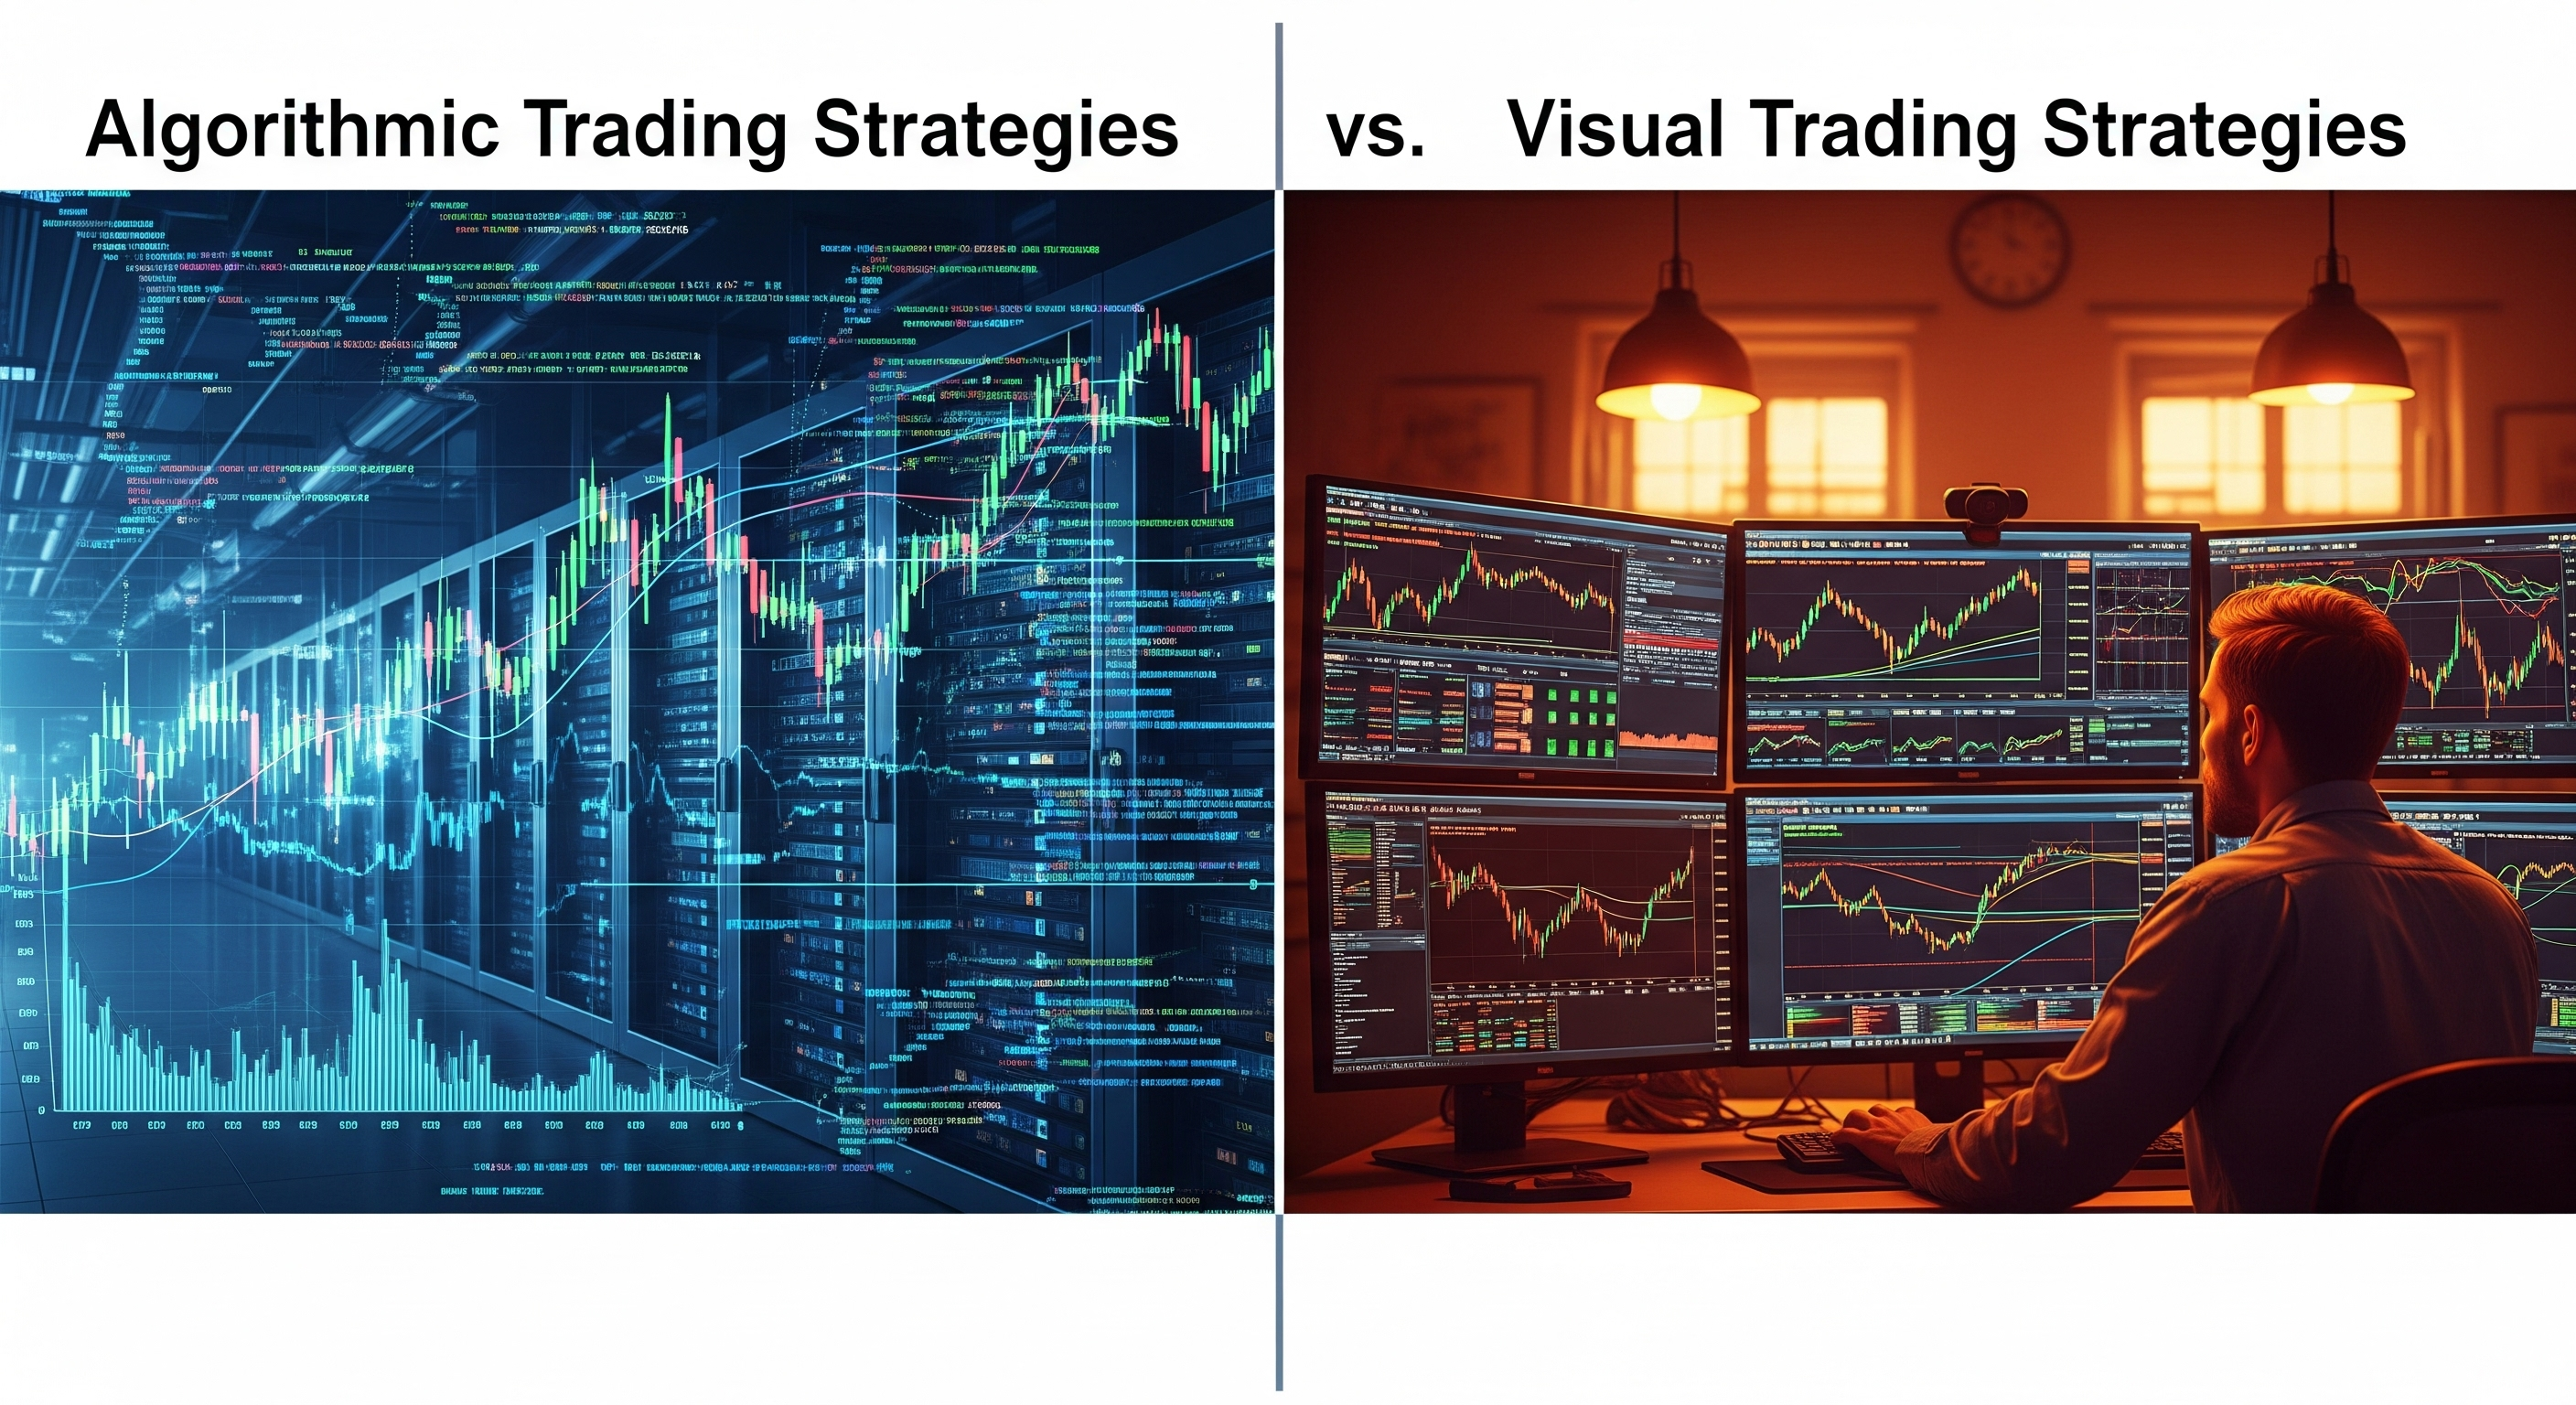
🤖 Algorithmic precision vs visual approximation in trading analysis
Multi-Timeframe Analysis ⏰📊
One of the most significant advantages of using structured data is the ability to perform multi-timeframe analysis seamlessly. This is where OHLC data really shines compared to static images! ✨
Multi-Timeframe Power
📅 Daily View
Long-term trend direction
Major support/resistance
Overall market sentiment
⏰ 4H View
Swing trading opportunities
Intermediate patterns
Session-based analysis
⚡ 15M View
Entry/exit timing
Scalping opportunities
Precise execution levels
With OHLC data, AI can simultaneously analyze multiple timeframes and create confluence-based strategies. For example, it might identify that the daily trend is bullish, the 4-hour chart shows a pullback to a key support level, and the 15-minute chart is forming a reversal pattern—all in real-time! 🚀
Try doing this with screenshots... you'd need to send multiple images, and by the time the AI processes them all, the market opportunity might be long gone! With structured data, this analysis happens in milliseconds, not minutes. ⚡
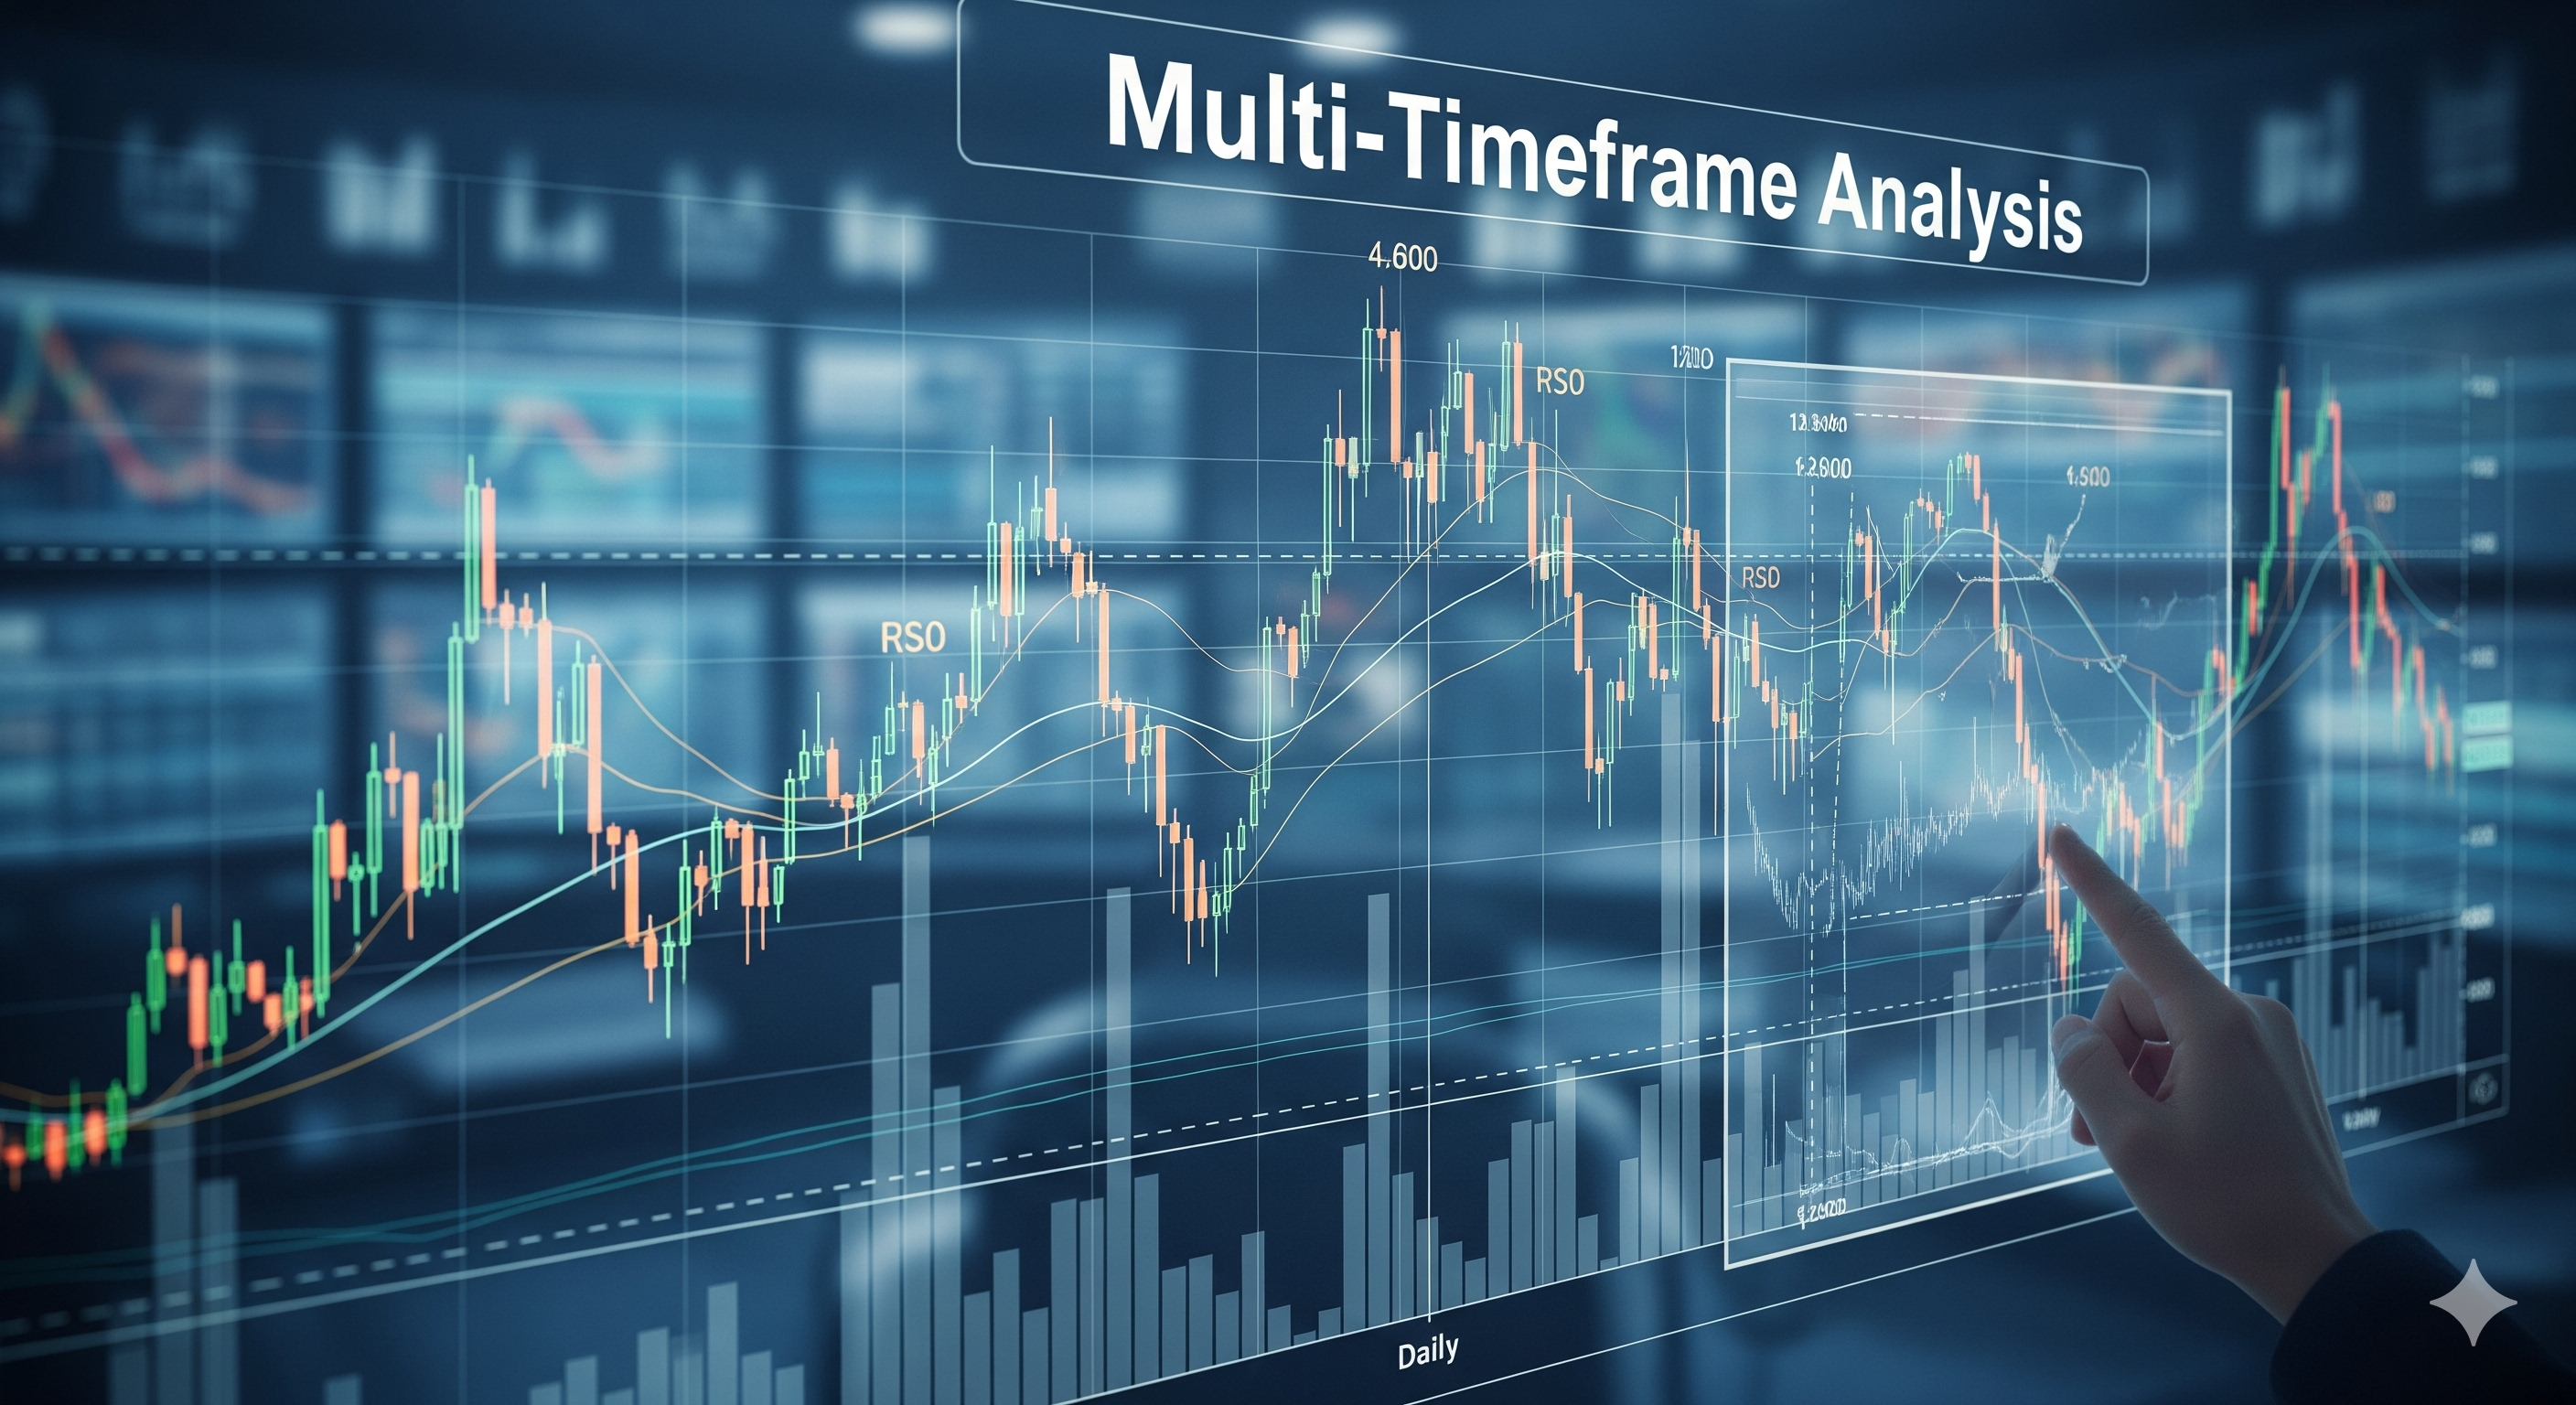
⏰ Multi-timeframe analysis: The power of simultaneous data processing
Case Studies: Using OHLC vs. Screenshots 📋🔬
Let me share some real-world scenarios that demonstrate the dramatic difference between these two approaches. These examples are based on actual trading situations where the choice of data format made or broke the trading opportunity! 💰
Case Study 1: EUR/USD Breakout Strategy
📸 Screenshot Approach
- • Trader sends chart image at 1.0850
- • AI identifies "potential breakout level"
- • Processing time: 15-30 seconds
- • By the time analysis is complete, price moved to 1.0865
- • Result: Missed opportunity
📊 OHLC Data Approach
- • Real-time data stream at 1.0850
- • AI calculates exact resistance at 1.0851
- • Processing time: 50 milliseconds
- • Entry triggered at 1.0852 breakout
- • Result: 15 pip profit captured
Case Study 2: RSI Divergence Detection
A trader wanted to identify RSI divergence on GBP/USD. Here's how each approach performed:
📸 Image Analysis
- • Visual approximation of RSI levels
- • "RSI appears to be around 65-70"
- • Cannot calculate exact divergence angle
- • Accuracy: ~70%
📊 OHLC Analysis
- • Precise RSI calculation: 67.34
- • Exact divergence angle: -2.3 degrees
- • Historical correlation analysis
- • Accuracy: 94%
These case studies highlight a crucial point: in trading, precision matters. The difference between a 67% RSI and a 70% RSI might seem small, but it can be the difference between a profitable trade and a losing one! 📈
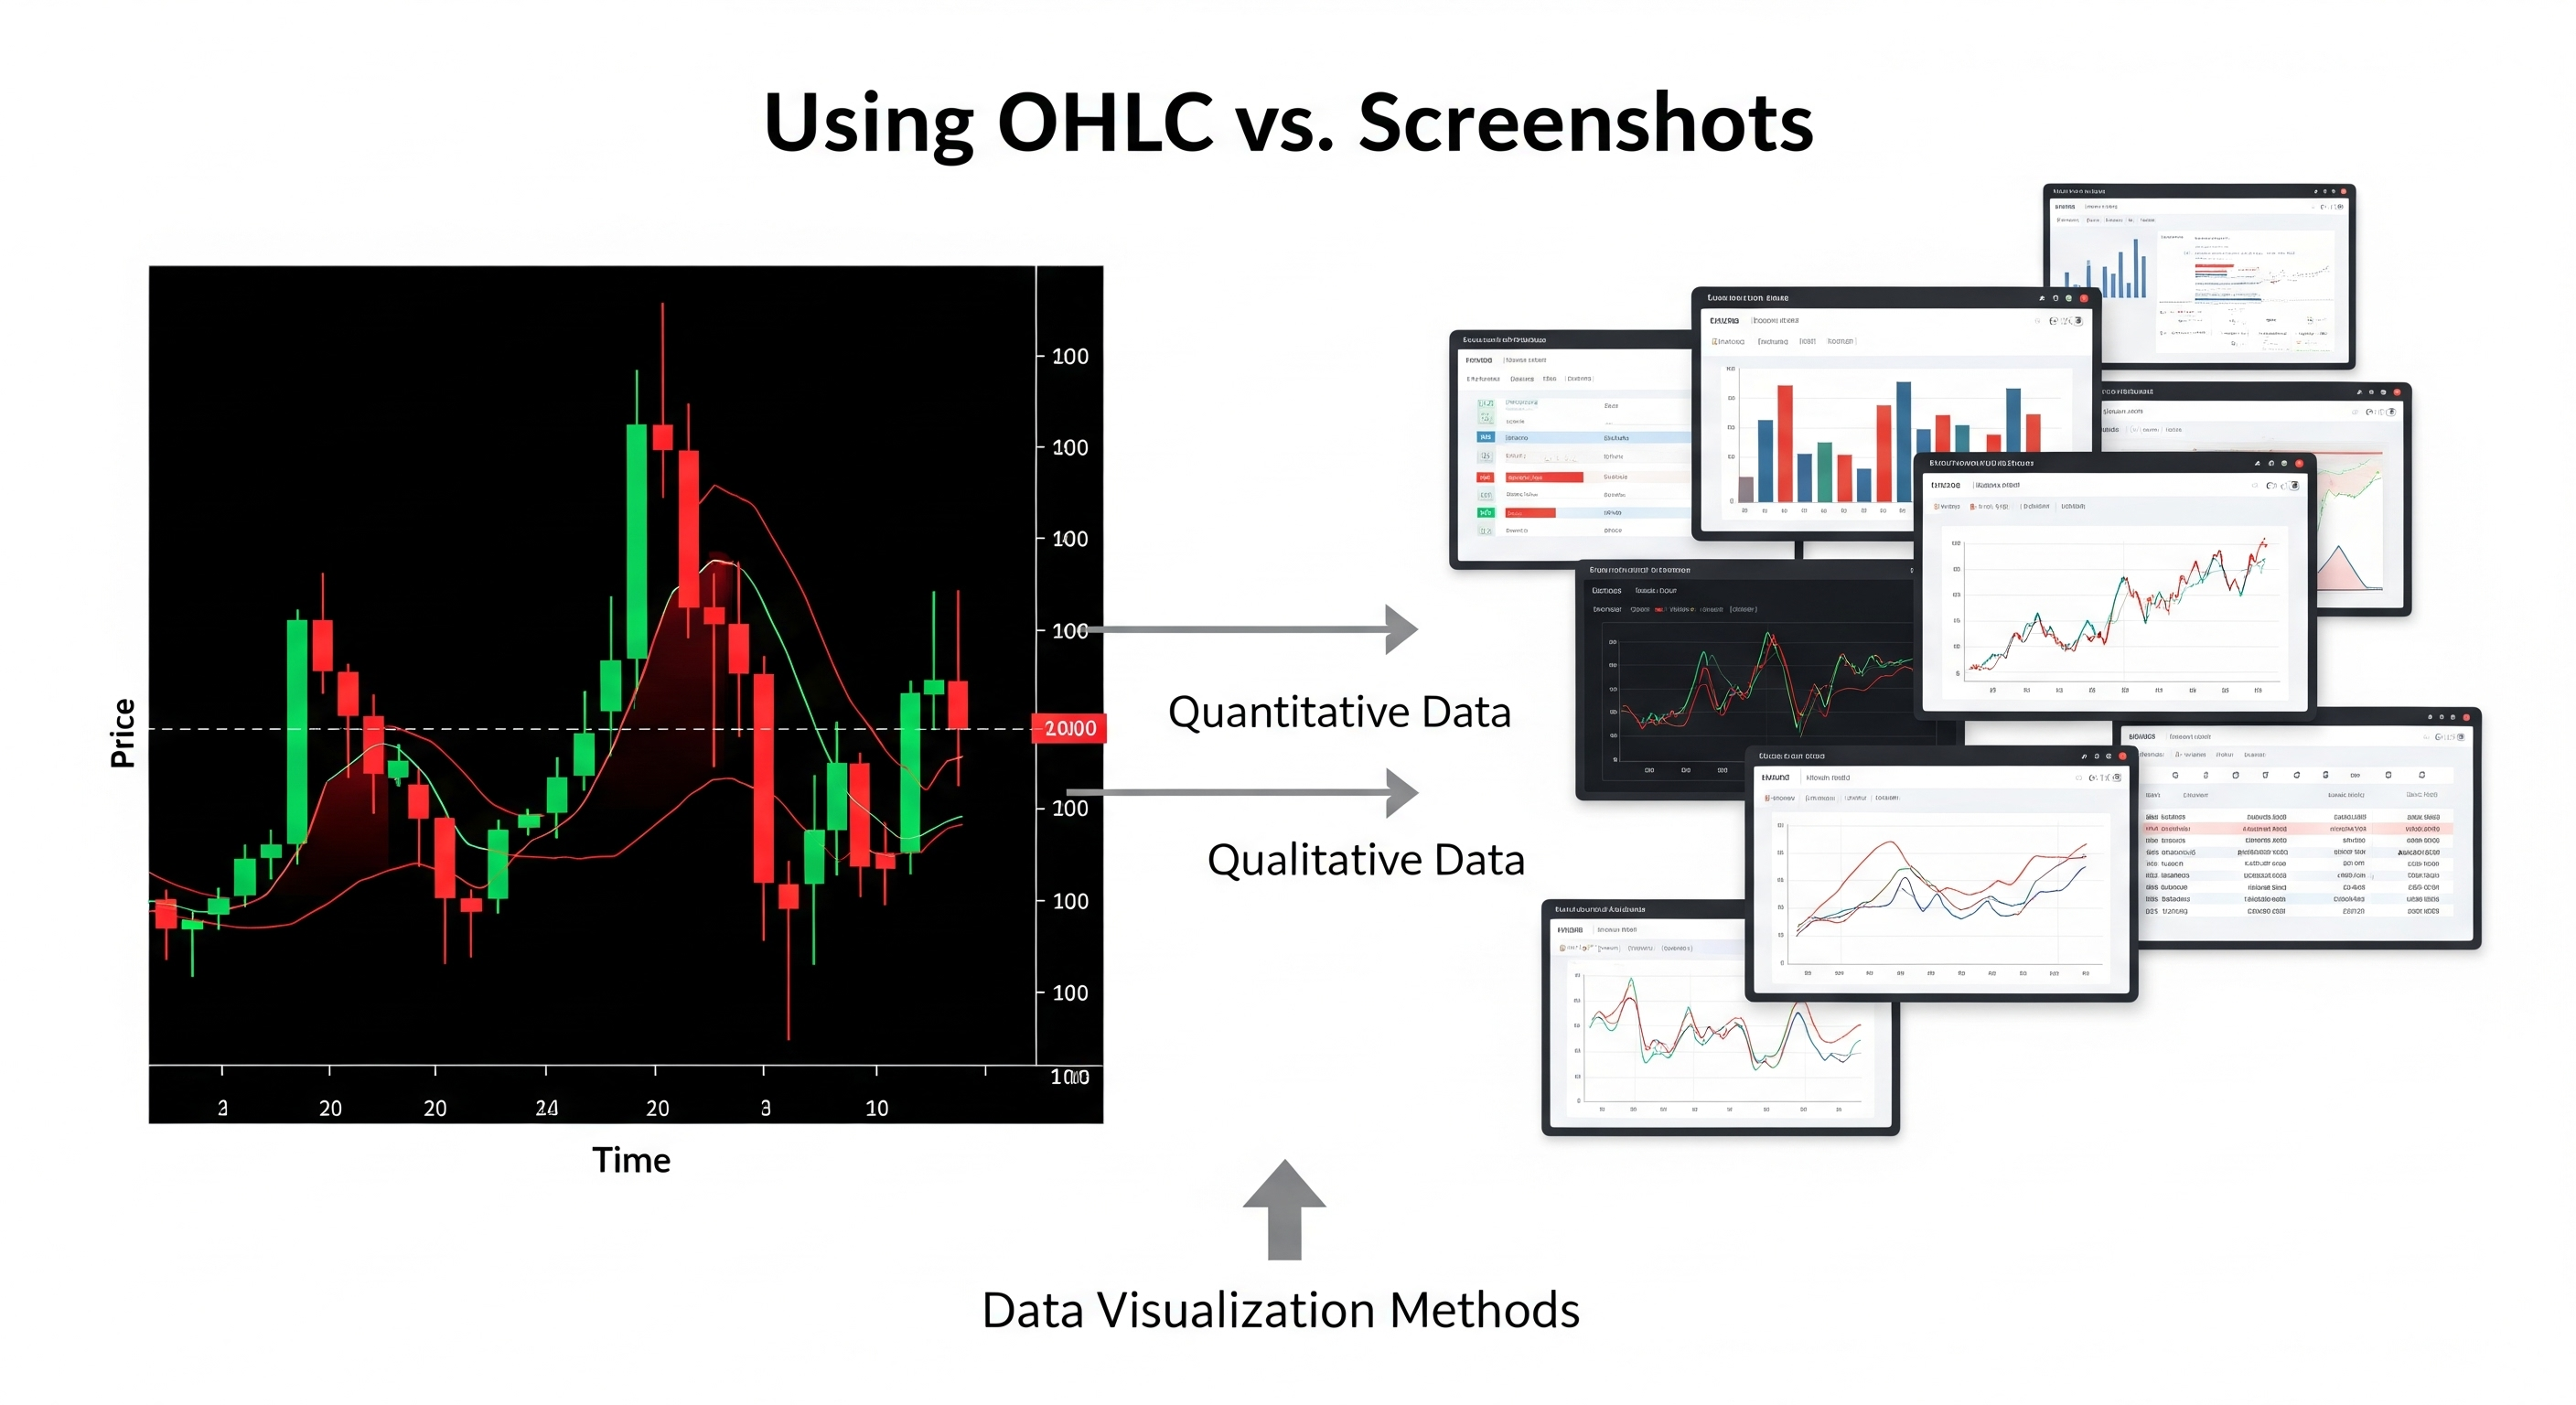
📋 Case study comparison: The precision advantage of structured data
AI Applications in Trading Using Real Data 🤖💹
When AI systems have access to structured market data, they can perform incredibly sophisticated analysis that would be impossible with image-based inputs. Let's explore some cutting-edge applications that are revolutionizing modern trading! 🚀
Machine Learning Pattern Recognition
AI can identify complex patterns across thousands of historical data points, recognizing subtle formations that human eyes might miss.
Real-Time Risk Management
Continuous monitoring of position sizes, correlation risks, and portfolio exposure using live data feeds.
Sentiment Analysis Integration
Combining price data with news sentiment, economic indicators, and social media trends for comprehensive analysis.
Predictive Modeling
Using historical OHLC data to build models that predict future price movements with statistical confidence intervals.
The beauty of these applications is that they all require precise numerical data to function effectively. You simply cannot achieve this level of sophistication with image-based analysis—it's like trying to perform surgery with a butter knife instead of a scalpel! 🔪
Speed and Accuracy Advantages ⚡🎯
In trading, speed kills—but in a good way! The faster you can analyze market conditions and execute trades, the better your chances of capturing profitable opportunities. Let's break down the performance differences between data formats:
Processing Speed Comparison
But speed isn't everything—accuracy is equally crucial. Here's where structured data really shines:
- 🎯 Precision: OHLC data provides exact values to 4-5 decimal places, while image analysis gives approximations that can be off by several pips.
- 🔄 Consistency: Structured data analysis produces identical results every time, whereas image interpretation can vary based on resolution, lighting, and other visual factors.
- 📈 Scalability: Processing thousands of data points simultaneously is trivial with OHLC data but nearly impossible with images.
- 🛡️ Error Reduction: No risk of misreading chart elements or missing important details that might be obscured in screenshots.
Think about high-frequency trading firms—they spend millions on infrastructure to gain microsecond advantages. Meanwhile, some traders are still sending screenshots that take 30 seconds to process! It's like bringing a horse to a Formula 1 race. 🐎🏎️
Integration with Modern Trading Platforms 🔗💻
Modern trading platforms are designed around data APIs, not image processing. When you use structured data, you're speaking the same language as professional trading infrastructure! 🗣️
MetaTrader 4/5
- • Direct API access to OHLC data
- • Real-time data streaming
- • Custom indicator development
- • Automated trading integration
TradingView
- • Pine Script data access
- • Webhook integrations
- • Multi-exchange data feeds
- • Custom strategy backtesting
Institutional APIs
- • Bloomberg Terminal data
- • Reuters Eikon feeds
- • Prime brokerage APIs
- • FIX protocol integration
The integration possibilities are endless when you work with structured data. You can build automated trading systems that react to market conditions in real-time, create custom alerts based on complex conditions, and even develop portfolio management tools that optimize your risk exposure across multiple instruments.
Try doing any of this with screenshots... good luck! 😅 You'd need an army of people manually interpreting images and typing in data. It's simply not scalable or practical for serious trading operations.
Historical Context: The Evolution of Trading 📚⏳
To truly appreciate why structured data is superior, let's take a quick journey through the evolution of trading technology. Understanding this history will show you why we've moved away from visual analysis toward data-driven approaches! 🕰️
📞 Phone-Based Trading
Traders called brokers, described what they saw on charts, and placed orders verbally. Talk about inefficient! 😅
💻 Electronic Trading Platforms
First generation of electronic platforms emerged, but still relied heavily on visual chart interpretation.
📊 Data-Driven Analysis
Introduction of APIs and structured data feeds. Professional traders began using quantitative analysis.
🤖 Algorithmic Trading Boom
High-frequency trading and AI-powered systems became mainstream. Speed and precision became everything.
🚀 AI-Powered Trading
Machine learning and AI systems that can process vast amounts of structured data in real-time. The future is here!
Notice the trend? We've consistently moved toward more data, faster processing, and greater precision. Using screenshots for AI analysis is like trying to go backwards in this evolution—it's fighting against decades of technological progress! 📈
The most successful traders and institutions today are those who embrace data-driven approaches. They understand that in a world where microseconds matter, spending 30 seconds to process an image is simply not competitive.
📚 The evolution of trading: From visual interpretation to data-driven precision
Conclusion: The Necessity of Structured Data in Modern Trading 🎯✨
After exploring the various aspects of data formats in AI-powered trading, the conclusion is crystal clear: structured market data (OHLC) is not just better than images—it's essential for serious trading operations in today's fast-paced markets! 💎
Key Takeaways
The evidence is overwhelming: whether you're a day trader looking for split-second entries, a swing trader analyzing multi-timeframe setups, or an algorithmic trader building automated systems, structured data provides the foundation for success that image-based analysis simply cannot match. 🏆
As we move forward into an increasingly AI-driven trading landscape, the traders who adapt to data-centric approaches will have a significant competitive advantage. Those who continue relying on screenshots and visual analysis will find themselves at a growing disadvantage—like trying to compete in a modern race with outdated equipment! 🏃♂️💨
So the next time you're tempted to send a screenshot to an AI system, remember: you're not just sending an image—you're sending a limitation. Instead, embrace the power of structured data and unlock the full potential of AI-powered trading analysis! 🚀
🎯 The future of trading: AI-powered structured data analysis
Ready to Upgrade Your Trading Analysis? 🚀
Experience the power of structured data analysis with MyForexAI's advanced trading platform.
Explore MyForexAI Features →